 logo
logo

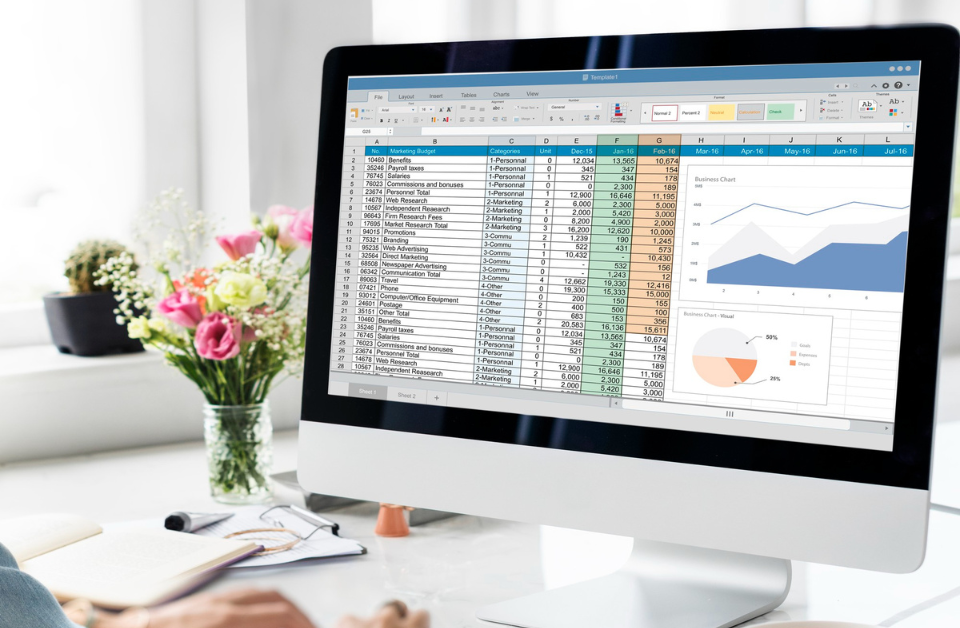
Analytical thinking remains one of the most important workplace skills, while AI and big data are among the fastest-growing skill areas through 2030, according to the World Economic Forum’s Future of Jobs Report 2025. For many professionals, Excel is still one of the most practical places to build that analytical foundation because it is accessible, flexible, and widely used in everyday business work.
If you are entering the workforce or trying to move into a more data-driven role in Saudi Arabia, learning Excel for data analysis can help you build core data analyst skills such as cleaning data, applying formulas, summarizing performance, spotting patterns, and presenting findings clearly.
Modern Excel also goes far beyond basic spreadsheets. Features such as XLOOKUP, PivotTables, Power Query, data models, and AI-assisted Analyze Data make it possible to move from raw data to structured analysis without starting with a programming language.
In Saudi Arabia, this learning path also fits the broader emphasis on lifelong learning, workforce competitiveness, and digital skills under the Human Capability Development Program of Saudi Vision 2030.

Why Excel Remains a Practical Data Analysis Skill in 2026
1. It applies across business functions
Excel is used in finance, HR, marketing, operations, sales, supply chains, and many other functions where teams need to organize information, compare results, monitor performance, and answer business questions. That makes it useful even if your job title is not “data analyst.”
2. It builds the foundations of analytical thinking
Learning Excel for data analysis is not only about memorizing formulas. It teaches you how to structure a dataset, define the question you are trying to answer, choose the right calculation, check for errors, and communicate the result. These habits transfer directly to other data analysis tools later in your learning journey.
3. Modern Excel can handle more advanced analysis workflows
If your Excel learning plan still stops at VLOOKUP and basic charts, it needs an update. Microsoft now recommends XLOOKUP as a more flexible lookup option in supported versions, while Power Query gives analysts a repeatable way to import, clean, combine, and reshape data.
Microsoft 365 users can also use Analyze Data in Excel to explore high-level summaries, trends, patterns, and natural-language questions. These features do not replace analytical judgment, but they can reduce manual work and help you explore a dataset faster.
4. Excel creates a natural bridge to Power BI
Once you are comfortable cleaning, transforming, summarizing, and visualizing data in Excel, moving into Power BI and the wider Microsoft analytics stack becomes easier. The logic you learn in tables, Power Query, data models, and reporting continues to matter when your datasets and dashboards become more complex.
5. It supports a skills-first approach to career growth
The value of Excel is not the certificate alone; it is the ability to prove that you can take messy business data and turn it into a clear answer. That is why practice, projects, and problem-solving should be part of your learning plan from the beginning.
How to Learn Excel for Data Analysis Step by Step
A strong learning path should move from spreadsheet basics to repeatable analysis workflows. Use these five steps as a practical roadmap.
Step 1: Master spreadsheet basics and core formulas
Start with Excel tables, cell references, data types, sorting, filtering, and core formulas such as SUM, AVERAGE, COUNTIF, SUMIF, and SUMIFS. The goal is not to learn every function; it is to become comfortable translating a business question into a calculation.
Step 2: Learn to clean and structure data
Real business data is rarely ready for analysis. Practice correcting data types, handling blanks, removing duplicates, standardizing text and dates, and checking for inconsistent values. Then add Power Query so you can turn repeated cleaning steps into a refreshable process instead of fixing the same file manually every month.
Step 3: Use modern lookup and analysis functions
After the basics, move to IF and IFS, XLOOKUP, INDEX and MATCH where compatibility requires them, COUNTIFS, SUMIFS, and – when your Excel version supports them – dynamic array functions such as FILTER, SORT, and UNIQUE. These tools help you combine, segment, and investigate data without building unnecessarily complex worksheets.
Step 4: Summarize and visualize what the data means
Learn PivotTables and PivotCharts, conditional formatting, chart selection, and simple dashboard design. The purpose is not to create more charts; it is to make the important result easier to see. Practice choosing the view that best answers the question rather than visualizing every available metric.
Step 5: Build projects and connect Excel to the wider analytics workflow
Apply your skills to realistic projects such as sales performance, budget variance, inventory movement, campaign results, or operational KPIs. Then expand into Power BI and SQL instead of treating Excel as the final destination. If your goal is to build a career as a data analyst in Saudi Arabia, this progression gives you a stronger portfolio than isolated formula practice.

How Far Should You Learn Excel Before Moving to Power BI?
You do not need to become an “Excel expert” before learning Power BI. A good point to expand is when you can confidently structure a table, clean common data issues, use core formulas and lookups, build PivotTables, and explain what your analysis means.
From there, Power Query, data modeling, Power BI, and SQL help you work with more sources, larger workflows, and more repeatable reporting. Excel remains part of the toolkit, but it becomes one stage in a complete data analysis process.
In Conclusion
Excel remains a strong starting point for anyone who wants to learn data analysis in 2026. The most useful path is not to memorize hundreds of functions; it is to learn how to clean data, investigate a question, summarize the result, and communicate it clearly.
If you want to build these skills through a structured learning path, IMP’s Data Analytics Training Courses cover Excel foundations and advanced skills such as Power Query, Power Pivot, and DAX, then expand into Power BI, SQL, descriptive statistics, data storytelling, automation, and business decision support. The training is built around practical assignments and includes a certificate of completion.
Explore the diploma and join the next learning path that fits your goals.